
By now, we’ve all come to grips with the fact that this is shaping up as the most monumental presidential election in (at least) a generation. The results in November will ultimately determine which way the Supreme Court will lean, who will be allowed into the country, how the nation will deal with Russia and China, even how we’ll pay for the roofs over our collective heads—or whether we’ll be able to. Conspiracy theories, email servers, taco bowls… Is there any aspect of American life that won’t be affected?
We’ve got it: It’s important. Even so, we’re getting a just a little bit played out, seeing that ever-changing electoral map every time we turn on CNN, Fox News, MSNBC—maybe even Syfy, Oxygen, and GOD TV.
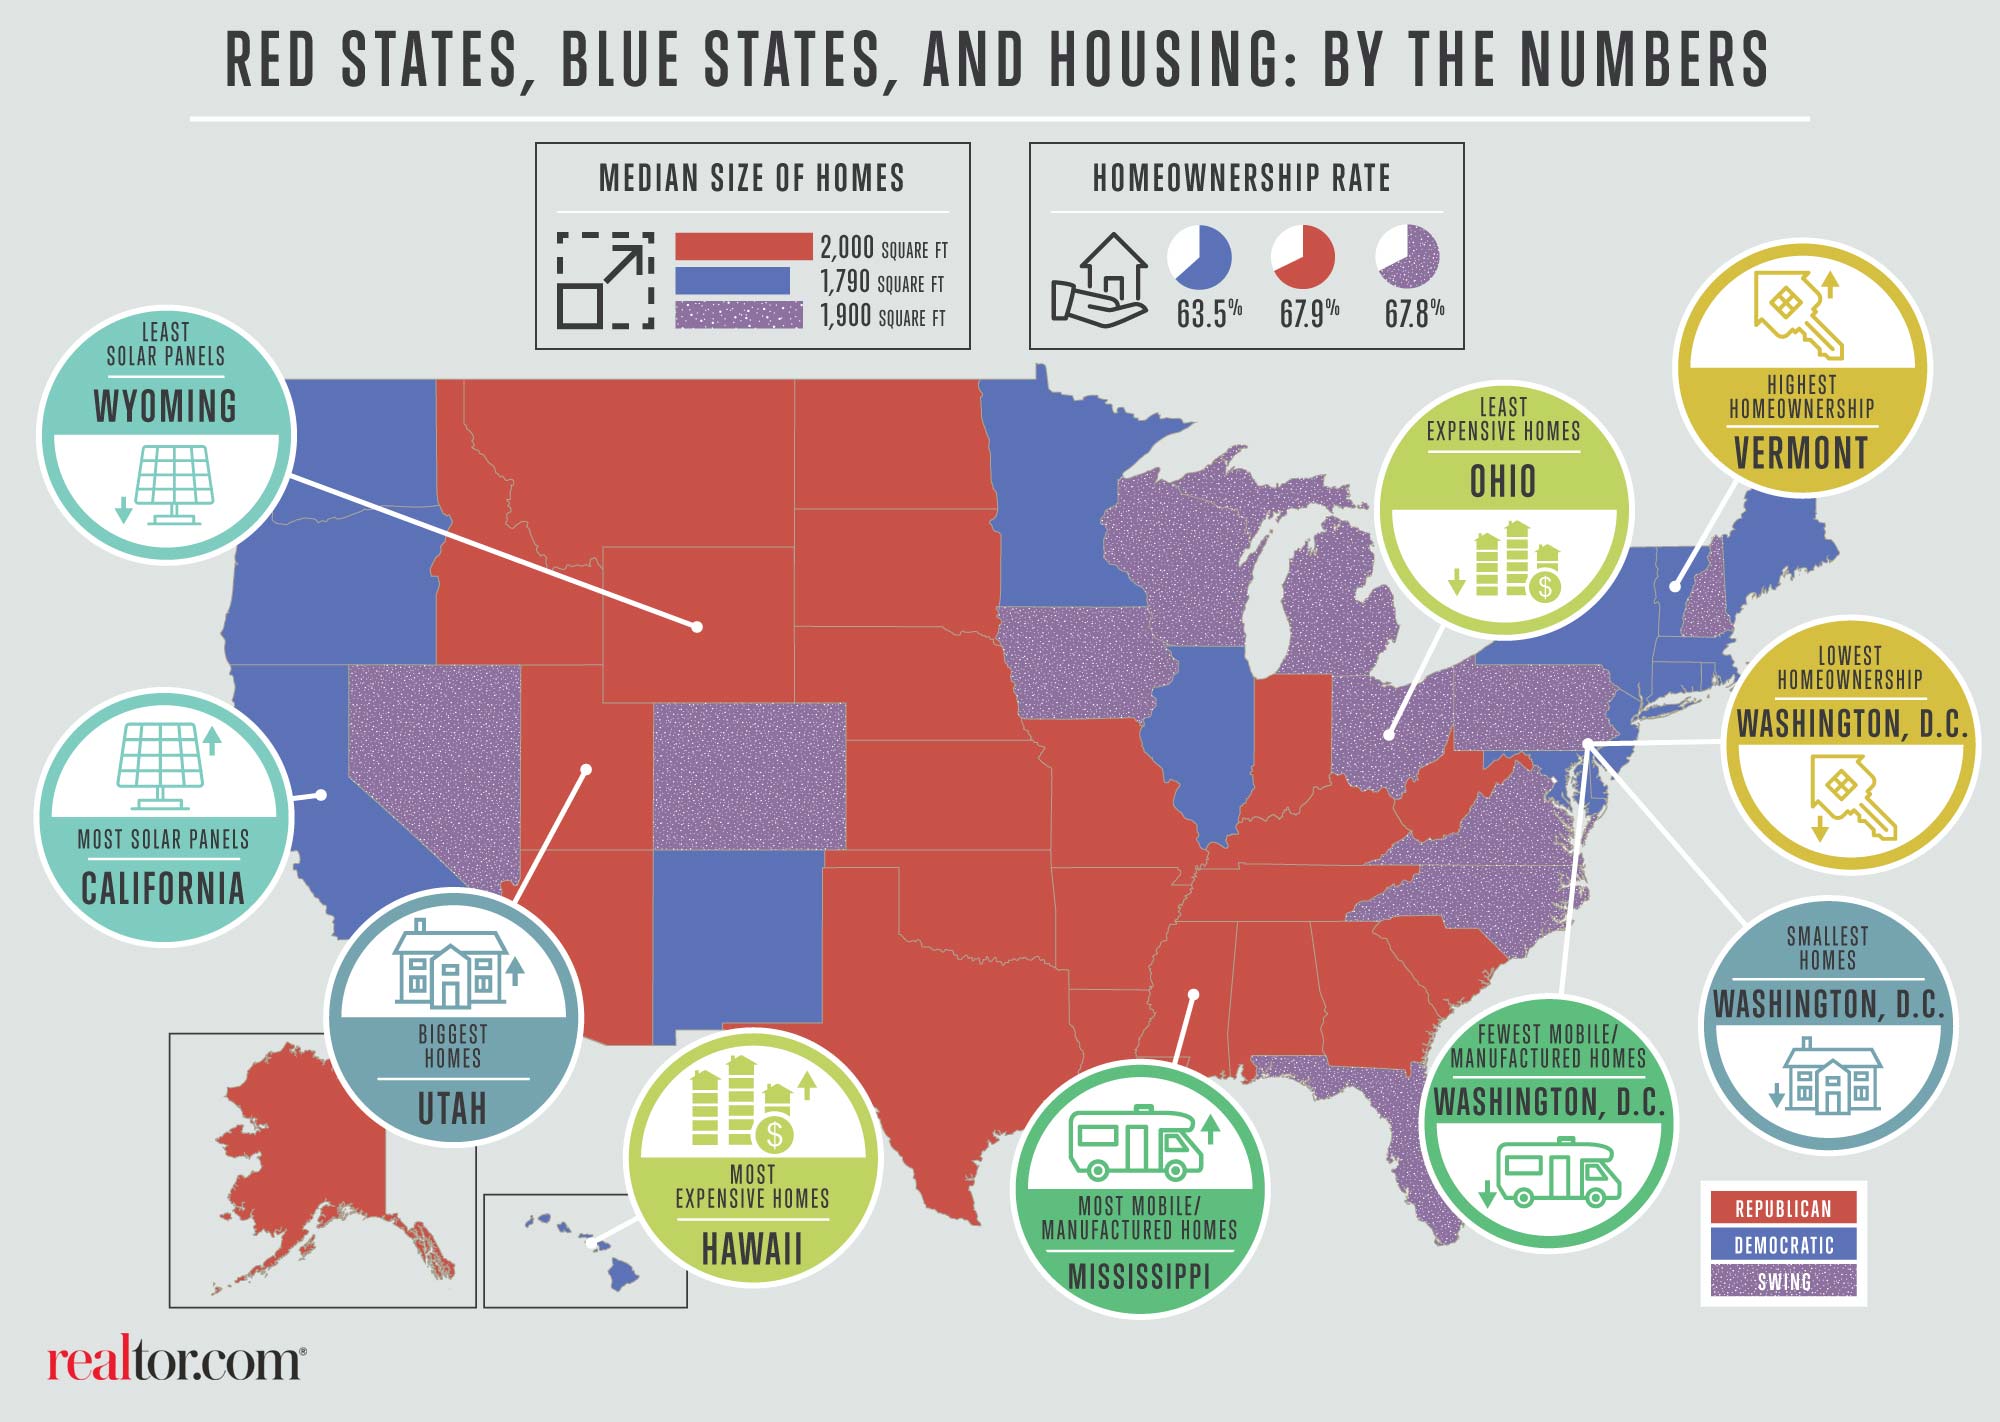
It seems that every political wonk is obsessively fixated on that darn map, and whether Republican-voting states will remain red, Democrat-voting states will stay blue and where swing states will, well, swing in the upcoming election.
The data team here at realtor.com® has already examined the residential real estate and tax policies of both Democrat Hillary Clinton and Republican Donald Trump. So this time, we decided to indulge our other obsessions—digging deep into the differences in how folks in blue, red, and swing states (which we’ve not so creatively dubbed purple states) actually live.
Who has the biggest homes? How about the most expensive residences? And while we’re on the topic, where do millennials stand the best chance of becoming homeowners?
We looked at data from Nielsen Demographics, Nielsen Scarborough, and Nielsen Financial, as well as our own, of course, to come up with our findings. We used Politico‘s list of those critical 11 swing states where the election will likely be won or lost—Colorado, Florida, Iowa, Michigan, Nevada, New Hampshire, North Carolina, Ohio, Pennsylvania, Virginia, and Wisconsin—as well as its lists of established red and blue states.
Our analysis confirmed some long-held beliefs about the differences between the Grand Old Party and the Democratic Party of Franklin D. Roosevelt. But it also upended some of our preconceived notions, and may provide some insight into why each candidate can inspire fervent devotion in some, and sheer, unadulterated terror in others.
“It speaks to the diversity that is America,” says realtor.com® Chief Economist Jonathan Smoke. “It’s really tough to see that there’s any one candidate who could appeal to all Americans. We reflect the cultures and the way of living from where we come from.”
So let’s head to the realtor.com electoral map!
1. Which states have the most expensive homes?
It’s long been known that Democratic strongholds, largely based in the Northeast and California, tend to be wealthier. Lucky them! The median household income in those states is $62,564—about 23 percent higher than red states, where it’s $50,820, and 13 percent more than in swing states, at $55,524.
And on top of that, 1.4 percent of households in left-minded blue states bring home $500,000 or more, which makes sense when factoring in all those six- and seven-figure bonuses on New York’s Wall Street and …read more
From:: Finance and Economy