

Stock Market Dashboard tracking major indexes
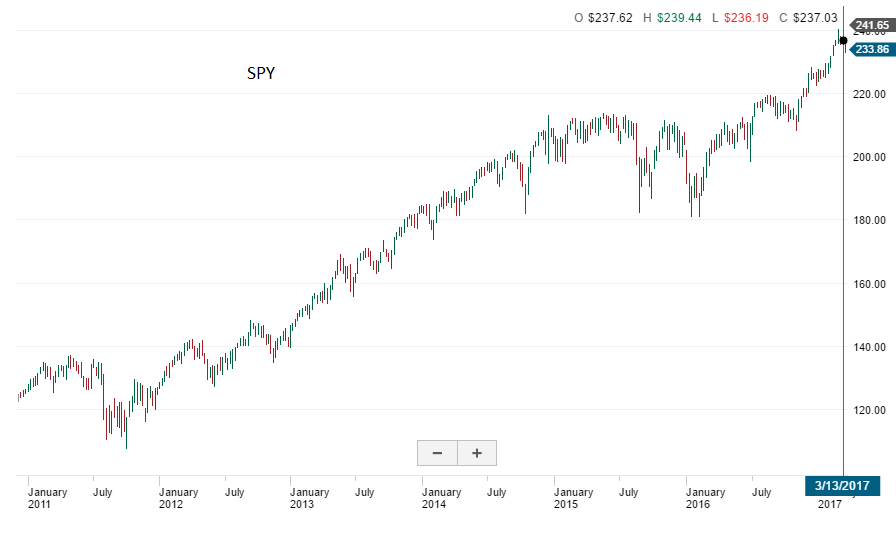
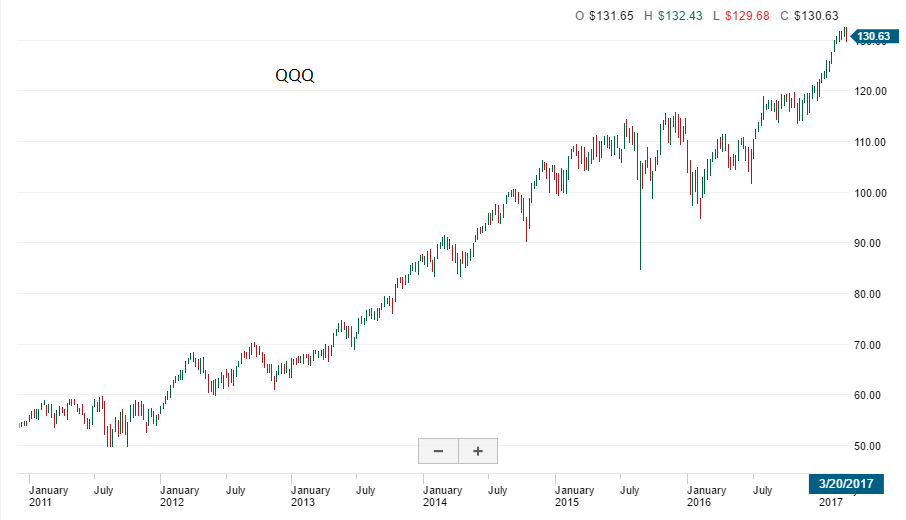
2016 saw a big pull back in the beginning of the year only to recover by March and rally after the elections. We have been in a bull market since 2008. How much longer can this bull market continue? The indexes did not rally the last week of 2016, possibly indicating a weak start for the Indexes in 2017. For 2016 the indexes finished up with the following returns. QQQ was up 5.92%, the SPY was up 9.62%, and the DOW finished up 13.42%. We may see several interest rate hikes by the FED in 2017.
Year to date Return on Major Indexes
Year to date returns for the major indexes, the SPY is up 4.62%, the QQQ is up 10.25% and the DOW is up 4.22% for the year from January 1, 2016.
The week ending 3-24-17
The major indexes have pull back slightly recently but the QQQ has been unfazed, still up 10% YTD. The pull back may be due to realization that the new president may have some trouble getting congress accomplish everything on his aggressive agenda. Market indexes continue to trade at or close to all time record highs. Is there more life to this Bull market? We may see a good year next year after a year of lackluster returns. We may need to see or hear more of the new administrations pro business policies for the markets to continue the rally, this could be big.
Usually January is the indicator for how the market will fair for the rest of the year. There are 4117 stocks above their 50 dma and 2496 below their 50 dma on the last trading day of the year.
Stock Ideas
Even in this turbulent market there are some nice looking charts. For stock ideas go to stock ideas with no booyah
SPY ETF Chart for Week Ending 3-24-17
QQQ ETF Chart for Week Ending 3-24-17
For pre and post market activity Nasdaq
ISM Index
ISM Index reported on December 1 for November is at 53.2% (up 1.3% from October)
The ISM above 50% for the 3 consecutive months.
The ISM Index is composite index of the manufacturing sector. From investopedia’s why this matters. By monitoring the ISM Manufacturing Index, investors are able to better understand national economic conditions. When this index is increasing, investors can assume that the stock markets should increase because of higher corporate profits. The opposite can be thought of the bond markets, which may decrease as the ISM Manufacturing Index increases because of sensitivity to potential inflation. To read the full report.